

Pipestone Energy Corp. Announces First Quarter 2023 Results, Provides an Update on the Alberta Wildfire Impact and Announces the Appointment of an Interim CEO
/EIN News/ -- CALGARY, Alberta, May 10, 2023 (GLOBE NEWSWIRE) -- (PIPE – TSX) Pipestone Energy Corp. (“Pipestone” or the “Company”) is pleased to report its first quarter 2023 financial and operational results. The Company also announced today that Paul Wanklyn, President and Chief Executive Officer, will be taking an immediate leave of absence for health reasons. Pipestone’s Board of Directors has appointed Dustin Hoffman, the Company’s Chief Operating Officer, as Interim President and Chief Executive Officer, effective immediately.
As of May 9th, the Company’s production curtailed by wildfires in the Grande Prairie region was reduced to approximately 5,000 boe/d from the previously reported approximately 20,000 boe/d. At this time, the Company has no known significant damage or loss to either its owned or any third-party infrastructure. Our thoughts are with the communities who have been or are continuing to be impacted by these wildfires.
Pipestone’s objectives for 2023 are to deliver continued efficient production growth, unlock the value of its asset through high impact delineation, and to deliver on shareholder returns, which are underpinned by the Company’s quarterly dividend and will be supplemented by share repurchases under the Normal Course Issuer Bid (“NCIB”).
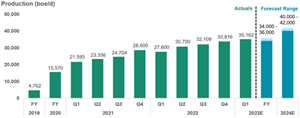
Pipestone had a very active first quarter, executing on approximately $106.6 million, or 42% of its planned 2023 capital expenditures at the midpoint of its $245 - $265 million guidance range. This development activity included drilling nine of the 27 planned 2023 drills and completing 14 of the 26 planned 2023 completions, effectively positioning the Company to deliver on its 2023 production guidance range of 34,000 – 36,000 boe/d. Production from Q1 2023 averaged 35,162 boe/d (41% liquids), which sits above the midpoint of full year guidance and represents the fourth consecutive quarter of record average production.
Pipestone Production History:
An infographic accompanying this announcement is available at
https://www.globenewswire.com/NewsRoom/AttachmentNg/c28ed5a2-956d-4084-aa48-5ce1f4b9f6a8
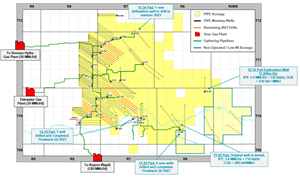
During the first half of 2023, Pipestone is engaging in several delineation activities in the southeastern portion of its acreage, situated within the Montney volatile oil window. In Q1 2023, Pipestone drilled two new wells on its 11-09 pad with an average lateral length of approximately 4,500 metres. These wells were drilled at an average cost of $3.4 million per well, or $765 per lateral metre drilled, which is approximately 14% below the Company’s 2023 budget cost per lateral metre drilled. Pipestone completed these two wells in April 2023 and is currently constructing wellsite facilities to enable extended flow tests later in Q2 2023.
Pipestone also re-tested the original well (100-02-20-070-06W6) on the 11-09 pad, which was completed in 2018 by its predecessor company. Over seven days of flow test, the well has produced an average of 3.4 MMcf/d raw gas and 710 bbl/d condensate (condensate-gas-ratio (“CGR”) of 209 bbl/MMcf). The two new wells on the 11-09 pad are nearly double the lateral length of the original well (2,300m vs. 4,500m). This summer, the Company plans to install a new gathering pipeline to tie the 11-09 pad into Pipestone’s existing 12-14 battery.
In addition, the Company has engaged in various land swaps with offsetting operators south of the Wapiti River, to further consolidate its operated land position. As a result, Pipestone drilled an additional delineation well off the 14-14 pad, which was completed in April 2023 and is expected to commence initial flowback operations later in Q2 2023.
Delineation Map:
An infographic accompanying this announcement is available at
https://www.globenewswire.com/NewsRoom/AttachmentNg/424a1709-d468-4cde-9bff-9f61b9ff3673
FIRST QUARTER 2023 CORPORATE HIGHLIGHTS
- In Q1 2023, Pipestone achieved record average quarterly production totaling 35,162 boe/d (29% condensate, 41% total liquids), which was a 7,581 boe/d or 27% increase over Q1 2022 production of 27,581 boe/d (29% condensate, 43% total liquids) and a 1,346 boe/d or 4% increase over Q4 2022 production of 33,816 boe/d (29% condensate, 42% total liquids). The Company remains well on track to achieve its annual production guidance of between 34,000 boe/d and 36,000 boe/d, with Q1 2023 production volumes already within this range;
- As a result of increased production volumes, the Company’s Q1 2023 adjusted funds flow from operations(1) of $84.9 million ($0.30 per share diluted) remained largely consistent with adjusted funds flow from operations(1) of $86.3 million ($0.30 per share diluted) in Q1 2022 despite weaker commodity prices realized. Pipestone’s adjusted funds flow from operations(1) in Q1 2023 was enhanced by $8.8 million or $2.78 per boe of realized gains on its commodity risk management contracts. Subsequent to the quarter, the Company has continued to opportunistically layer on additional WTI hedges to reduce its exposure to oil volatility in the remainder of 2023;
- Pipestone generated strong returns on invested capital with Q1 2023 annualized CROIC(1) and ROCE(1) of 26.5% and 20.9%, respectively, compared to Q1 2022 annualized CROIC(1) and ROCE(1) of 34.7% and 35.4%, respectively;
- The Company has front-loaded its capital expenditures in 2023 which will de-risk the Company’s ability to deliver on its annual production guidance. In Q1 2023 a significant portion of the 2023 capital budget was utilized to drill nine of 27 planned wells (33%) and complete 14 of 26 planned wells (54%). This capital investment of $106.6 million, before capitalized general and administrative expense, represents 42% of the full year budget (using the $255.0 million mid-point of guidance);
- The Company exited the first quarter of 2023 with a net debt(1) balance of $150.4 million (March 31, 2022 - $204.5 million). The Company’s ratio of net debt(1) to annualized trailing quarter adjusted funds flow from operations(1) at March 31, 2023 was 0.4 times (March 31, 2022 – 0.6 times) which demonstrates the continued strength of Pipestone Energy’s financial position;
- Pipestone executed upon its enhanced shareholder return framework with the payment of its inaugural quarterly dividend of $0.030 per common share ($8.4 million total) on March 31, 2023, to common shareholders of record on March 15, 2023. The dividend was designated as an “eligible dividend” for Canadian income tax purposes. The quarterly dividend is the cornerstone of the Company’s strategy to return capital to shareholders and represents an annualized yield of 4.3% based on the March 31, 2023 closing price of the common shares on the TSX of $2.77; and
- On May 10, 2023, the Company’s board of directors declared its second quarterly dividend of $0.030 per common share, which will be payable on June 30, 2023, to shareholders of record at the close of business on June 15, 2023. The dividend is designated as an “eligible dividend” for Canadian income tax purposes
(1) See “Advisory Regarding Non-GAAP Measures – Non-GAAP Measures” advisory.
| Pipestone Energy Corp. – Financial and Operating Highlights | ||||||
|
Three months ended March 31, |
||||||
| (CAD$ thousands, except where otherwise noted) |
2023 | 2022 | ||||
| Financial | ||||||
| Sales of liquids and natural gas | $ | 149,009 | $ | 153,530 | ||
| Cash from operating activities | 78,000 | 64,012 | ||||
| Adjusted funds flow from operations(1) | 84,881 | 86,317 | ||||
| Per share, basic | 0.30 | 0.45 | ||||
| Per share, diluted | 0.30 | 0.30 | ||||
| Capital expenditures, including capitalized G&A | 107,496 | 77,959 | ||||
| Free cash flow (deficit)(1) | (22,615) | 8,358 | ||||
| Income and comprehensive income | $ | 30,882 | $ | 27,052 | ||
| Per share, basic | 0.11 | 0.14 | ||||
| Per share, diluted | 0.11 | 0.10 | ||||
| Adjusted EBITDA(1) | 89,347 | 91,039 | ||||
| Annualized cash return on invested capital (CROIC)(1) | 26.5% | 34.7% | ||||
| Annualized return on capital employed (ROCE)(1) | 20.9% | 35.4% | ||||
| Net debt (end of period)(1) | $ | 150,409 | $ | 204,459 | ||
| Net debt to annualized adjusted funds flow from operations for the trailing period(1) | 0.4x | 0.6x | ||||
| Available funding(end of period)(1) | 129,432 | 75,232 | ||||
| Dividends paid per share | $ | 0.03 | $ | - | ||
| Dollar amount purchased under NCIB | - | 7,181 | ||||
| Number of common shares purchased under NCIB (000s) | - | 1,485 | ||||
| Common shares outstanding (000s) (end of period) | 279,500 | 191,125 | ||||
| Weighted-average basic shares outstanding (000s) | 279,246 | 191,790 | ||||
| Weighted-average diluted shares outstanding (000s) | 281,830 | 285,998 | ||||
| Operations | ||||||
| Production | ||||||
| Condensate (bbls/d) | 9,691 | 7,963 | ||||
| Other natural gas liquids (NGLs) (bbls/d) | 4,443 | 3,861 | ||||
| Total NGLs (bbls/d) | 14,134 | 11,824 | ||||
| Crude oil (bbls/d) | 351 | 33 | ||||
| Natural gas (Mcf/d) | 124,063 | 94,346 | ||||
| Total (boe/d)(2) | 35,162 | 27,581 | ||||
| Condensate (% of total production) | 28% | 29% | ||||
| Total liquids (% of total production) | 41% | 43% | ||||
| Average realized prices(3) | ||||||
| Condensate (per bbl) | $ | 101.56 | $ | 121.38 | ||
| Other NGLs (per bbl) | 41.95 | 55.47 | ||||
| Total NGLs (per bbl) | 82.82 | 99.86 | ||||
| Crude oil (per bbl) | 92.45 | 104.71 | ||||
| Natural gas (per Mcf) | 3.65 | 5.53 | ||||
| Netbacks | ||||||
| Revenue (per boe) | $ | 47.09 | $ | 61.85 | ||
| Realized gain (loss) on commodity risk management contracts (per boe) | 2.78 | (4.94) | ||||
| Royalties (per boe) | (3.95) | (4.21) | ||||
| Operating expense (per boe) | (13.49) | (11.02) | ||||
| Transportation expense (per boe) | (3.26) | (3.99) | ||||
| Operating netback (per boe)(1) | 29.17 | 37.69 | ||||
| Adjusted funds flow netback (per boe)(1) | 26.83 | 34.77 | ||||
(1) See “Advisory Regarding Non-GAAP measures – Non-GAAP Measures” advisory.
(2) For a description of the boe conversion ratio, see “Advisories Regarding Oil and Gas Information - Basis of Barrel of Oil Equivalent”. References to crude oil in production amounts are to the product type “tight oil” and references to natural gas in production amounts are to the product type “shale gas”. References to total liquids include oil and natural gas liquids (including condensate, pentane, butane, propane and ethane).
(3) Figures calculated before hedging.
Q1 2023 Operations Update
Since the beginning of 2023, Pipestone has drilled and rig-released the final three of four wells on the second occupation of the 02-31 pad, rig-released four wells during the second occupation of the 02-25 pad and drilled a water disposal well at the 06-30 pad. In addition to the delineation activity South of the Wapiti River at the 11-09 and 14-14 pad-sites, the Company also commenced drilling on five additional wells in April 2023 on the second occupation of the 14-19 pad, north of the Wapiti River.
In late December 2022, the Company commenced frac operations on the six wells located at the 11-05 pad which continued into January 2023. The 11-05 pad facilities were constructed in February 2023 and the six wells were brought on production at the beginning of March 2023. The six wells achieved an average IP60 of 4.4 MMcf/d raw gas and 382 bbls/d wellhead condensate (CGR of 87 bbl/MMcf), meeting the VRGC1 type curve expectation. In March 2023, the eight additional wells drilled at the 02-31 and 02-25 pad-sites were also completed with initial flow back operations ongoing with all wells expected to be on production by mid May 2023. In April 2023, the two wells drilled at the 11-09 pad site and single well drilled at the 14-14 were also completed with flow back operations expected later in Q2 2023.
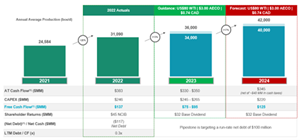
2023 Guidance and 2024 Outlook
With the positive Q1 2023 results the Company is reaffirming its 2023 Guidance and 2024 Outlook as outlined below:
An infographic accompanying this announcement is available at
https://www.globenewswire.com/NewsRoom/AttachmentNg/dd949790-6545-4d36-ad02-169fd8420f8d
Banking Update:
Pipestone has closed on its Reserve Based Loan (“RBL” or “Credit Facility”) renewal with its corporate banking syndicate, consisting of National Bank Financial Inc., Bank of Montreal, ATB Financial, Canadian Western Bank and Business Development Bank of Canada. The Credit Facility’s borrowing base and available capacity has been maintained at $280 million on a fully conforming basis. The maturity date for the RBL has been extended to May 30, 2025.
Risk Management Update:
Pipestone views commodity price risk management as integral to protecting its capital program and preserving optionality with respect to its shareholder return objectives. The Company capitalized on improvements in the price of West Texas Intermediate (“WTI”) crude oil in early April to add to its hedge positions for the remainder 2023, as shown in the updated hedging table below.
| 2023 | ||||||||
| Month | MAY | JUN | JUL | AUG | SEP | OCT | NOV | DEC |
|
Volumes (bbls/d) |
3,000 | 3,000 | 2,000 | 2,000 | 1,750 | 1,500 | 1,250 | 1,000 |
| Avg. Swap Price (C$/bbl) |
$107 | $106 | $106 | $105 | $105 | $104 | $103 | $102 |
Q1 2023 Financial Results Conference Call Details:
A conference call has been scheduled for May 10, 2023 at 10:00 a.m. Mountain Time (12:00 p.m. Eastern Time) for interested investors, analysts, brokers, and media representatives.
Please use the following participant URL to join the Q1 2023 financial results conference call: https://register.vevent.com/register/BI73d34a94480943c8953c1ed839164176. This registration link can also be found on the Company’s website at www.pipestonecorp.com. This link will provide each registrant with a toll-free dial-in number and a unique PIN to connect to the call.
Annual Meeting of Shareholders:
Pipestone will host its Annual Meeting of Shareholders in a virtual-only format via live audio webcast at 10:00 a.m. Mountain Time (12:00 p.m. Eastern Time) on June 22, 2023. To participate in the meeting, visit https://web.lumiagm.com/272337125.
Pipestone Energy Corp.
Pipestone is an oil and gas exploration and production company focused on developing its large contiguous and condensate rich Montney asset base in the Pipestone area near Grande Prairie. Pipestone is committed to building long term value for our shareholders while maintaining the highest possible environmental and operating standards, as well as being an active and contributing member to the communities in which it operates. Pipestone has achieved certification of all its production from its Montney asset under the Equitable Origin EO100™ Standard for Responsible Energy Development. Pipestone shares trade under the symbol PIPE on the TSX. For more information, visit www.pipestonecorp.com.
Pipestone Contacts:
| Dustin Hoffman Chief Operating Officer and Interim President and Chief Executive Officer (587) 392-8423 dustin.hoffman@pipestonecorp.com |
Craig Nieboer Chief Financial Officer (587) 392-8408 craig.nieboer@pipestonecorp.com |
|
Dan van Kessel VP Corporate Development (587) 392-8414 dan.vankessel@pipestonecorp.com |
Advisory Regarding Non-GAAP Measures
Non-GAAP measures
This news release includes references to financial measures commonly used in the oil and natural gas industry. The terms “adjusted funds flow from operations”, “operating netback”, “adjusted funds flow netback”, “available funding”, “adjusted working capital”, “cash flow”, “free cash flow”, “net debt”, “adjusted EBITDA”, “CROIC” and “ROCE” are not defined under IFRS, which have been incorporated into Canadian GAAP, as set out in Part 1 of the Chartered Professional Accountants Canada Handbook – Accounting, are not separately defined under GAAP, and may not be comparable with similar measures presented by other companies. The reconciliations of these non-GAAP measures to the nearest GAAP measure are discussed in the Non-GAAP measures section of Pipestone’s MD&A for the three months ended March 31, 2023 dated May 10, 2023, a copy of which is available electronically on Pipestone’s SEDAR profile at www.sedar.com.
Management of the Company believes the presentation of non-GAAP measures provide useful information to investors and shareholders as the measures provide increased transparency and the opportunity to better analyze and compare performance against prior periods.
Adjusted funds flow from operations
Pipestone uses “adjusted funds flow from operations” (cash from operating activities before changes in non-cash working capital, cash share-based compensation and decommissioning provision costs incurred, if applicable), a measure that is not defined under IFRS. Adjusted funds flow from operations should not be considered an alternative to, or more meaningful than, cash from operating activities, income (loss) or other measures determined in accordance with IFRS as an indicator of the Company’s performance. Management uses adjusted funds flow from operations to analyze operating performance and leverage and believes it is a useful supplemental measure as it provides an indication of the funds generated by Pipestone’s principal business activities prior to consideration of changes in working capital, cash share-based compensation and decommissioning provision costs incurred.
The following table reconciles cash from operating activities to adjusted funds flow from operations:
|
Three months ended March 31, |
|||
| ($ thousands) | 2023 | 2022 | |
| $ | $ | ||
| Cash from operating activities | 78,000 | 64,012 | |
| Changes in non-cash working capital | 6,820 | 22,305 | |
| Decommissioning provision costs incurred | 61 | - | |
| Adjusted funds flow from operations | 84,881 | 86,317 | |
Operating netback and adjusted funds flow netback
Operating netback is calculated on either a total dollar or per-unit-of-production basis and is determined by deducting royalties, operating and transportation expenses from liquids and natural gas sales adjusted for realized gains/losses on commodity risk management contracts.
The following table details the calculation of operating netback on a total dollar basis:
|
Three months ended March 31, |
|||||
| ($ thousands) | 2023 | 2022 | |||
| $ | $ | ||||
| Sales of liquids and natural gas | 149,009 | 153,530 | |||
| Realized (loss) gain on commodity risk management contracts | 8,786 | (12,253) | |||
| Royalties | (12,510) | (10,449) | |||
| Operating expense | (42,680) | (27,365) | |||
| Transportation expense | (10,302) | (9,912) | |||
| Operating netback | 92,303 | 93,551 | |||
The following table reconciles cash from operating activities to operating netback:
|
Three months ended March 31, |
||||||
| ($ thousands) | 2023 | 2022 | ||||
|
$ |
$ | |||||
| Cash from operating activities | 78,000 | 64,012 | ||||
| Change in non-cash working capital | 6,820 | 22,305 | ||||
| G&A expense | 2,956 | 2,512 | ||||
| Cash financing expense | 5,108 | 4,509 | ||||
| Decommissioning provision costs incurred | 61 | - | ||||
| Realized (gain) loss on interest rate risk management contracts | (642) | 213 | ||||
| Operating netback | 92,303 | 93,551 | ||||
| G&A expense | 2,956 | 2,512 | ||||
| Cash financing expense | 5,108 | 4,509 | ||||
| Realized (gain) loss on interest rate risk management contracts | (642) | 213 | ||||
| Adjusted funds flow netback | 84,881 | 86,317 | ||||
Adjusted funds flow netback reflects adjusted funds flow from operations on a per-unit-of-production basis and is determined by dividing adjusted funds flow from operations by total production on a per-boe basis. Adjusted funds flow netback can also be determined by deducting G&A, cash financing expense and adjusting for realized gains/losses on interest rate risk management contracts on a per-unit-of-production basis from the operating netback. Refer to “Financial and Operating Results” and “Netback Analysis” sections above for further details on the inputs and calculation of operating netback and adjusted funds flow netback on a per-unit-of-production basis.
Operating netback and adjusted funds flow netback are common metrics used in the oil and natural gas industry and are used by the Company’s management to measure operating results on a per boe basis to better analyze and compare performance against prior periods, as well as formulate comparisons against peers. These measures should not be considered an alternative to or more meaningful than cash from operating activities defined under IFRS.
Adjusted working capital and available funding
Available funding is comprised of adjusted working capital and undrawn portions of the Company’s credit facility. The available funding measure allows management and others to evaluate the Company’s short-term liquidity. Adjusted working capital is a non-GAAP measure and is comprised of current assets less current liabilities on the Company’s consolidated statement of financial position and excludes the current portion of risk management contracts and lease liabilities. Adjusted working capital should not be considered an alternative to, or more meaningful than, working capital as defined under IFRS. Also refer to the “Liquidity and Capital Resources” section of this MD&A for additional information and reconciliations.
Cash flow
Cash flow is a non-GAAP measure that is calculated as cash from operating activities plus changes in non-cash working capital, cash share-based compensation and decommissioning provision costs incurred, and is not defined under IFRS. Cash flow should not be considered an alternative to, or more meaningful than, cash from operating activities, income (loss) or other measures determined in accordance with IFRS as an indicator of the Company’s performance. Management uses cash flow to analyze operating performance and leverage and believes it is a useful supplemental measure as it provides an indication of the funds generated by Pipestone’s principal business activities prior to consideration of changes in working capital, cash share-based compensation and decommissioning provision costs incurred.
The following table reconciles cash from operating activities to cash flow:
|
Three months ended March 31, |
||||
| ($ thousands) | 2023 | 2022 | ||
| $ | $ | |||
| Cash from operating activities | 78,000 | 64,012 | ||
| Change in non-cash working capital | 6,820 | 22,305 | ||
| Decommissioning provision costs incurred | 61 | - | ||
| Cash flow | 84,881 | 86,317 | ||
Free Cash Flow
Free cash flow should not be considered an alternative to, or more meaningful than, cash from operating activities as determined in accordance with IFRS as an indicator of financial performance. Free cash flow is presented to assist management and investors in analyzing operating performance by the business and how much cash flow is available for deleveraging and / or shareholder returns in the stated period after capital expenditures have been incurred. Free cash flow equals cash from operating activities plus the change in non-cash working capital, cash share-based compensation and decommissioning provision costs incurred less capital expenditures.
The following table reconciles cash from operating activities to free cash flow:
|
Three months ended March 31, |
|||||
| ($ thousands) | 2023 | 2022 | |||
| $ | $ | ||||
| Cash from operating activities | 78,000 | 64,012 | |||
| Change in non-cash working capital | 6,820 | 22,305 | |||
| Decommissioning provision costs incurred | 61 | - | |||
| Capital expenditures | (107,496) | (77,959) | |||
| Free cash flow (deficit) | (22,615) | 8,358 | |||
Net debt (cash)
Net debt (cash) is a non-GAAP measure that equals bank debt outstanding plus adjusted working capital deficit and excluding dividends payable. Net debt is considered to be a useful measure in assisting management and investors to evaluate Pipestone’s financial strength. Also refer to the “Liquidity and Capital Resources” section of this MD&A for additional information and reconciliations.
Adjusted EBITDA, CROIC and ROCE
Adjusted EBITDA is calculated as profit or loss before interest, income taxes, depletion and depreciation, adjusted for other non-cash and extraordinary items including unrealized gains and losses on risk management contracts, realized losses on interest rate risk management contracts, share-based compensation and E&E expense. Adjusted EBITDA is considered a useful measure by management to understand and compare the profitability of Pipestone to other companies excluding the effects of capital structure, taxation and depreciation. Adjusted EBITDA is not defined under IFRS and therefore may not be comparable with the calculation of similar measures by other entities and should not be considered an alternative to, or more meaningful than, income (loss) and comprehensive income (loss). Adjusted EBITDA is also used to calculate CROIC. Adjusted EBIT is calculated as adjusted EBITDA less depletion and depreciation. Adjusted EBIT is used to calculate ROCE.
The following table reconciles income and comprehensive income to adjusted EBITDA:
|
Three months ended March 31, |
|||||
| ($ thousands) | 2023 | 2022 | |||
| $ | $ | ||||
| Income (loss) and comprehensive income (loss) | 30,882 | 27,052 | |||
| Deferred income tax expense (recovery) | 10,612 | 7,578 | |||
| Financing expense | 5,460 | 6,090 | |||
| Unrealized gain on interest rate risk management contracts | 634 | (886) | |||
| Realized loss on interest rate risk management contracts | (642) | 213 | |||
| D&D expense | 35,755 | 17,943 | |||
| E&E expense | 829 | - | |||
| Share-based compensation | 1,413 | 1,436 | |||
| Unrealized loss on commodity risk management contracts | 4,404 | 31,613 | |||
| Adjusted EBITDA | 89,347 | 91,039 | |||
CROIC is determined by dividing adjusted EBITDA by the gross carrying value of the Company’s oil and gas assets at a point in time. For the purposes of the CROIC calculation, the net carrying value of the Company’s exploration and evaluation assets, property and equipment and ROU assets, is taken from the Company’s consolidated statement of financial position, and excludes accumulated depletion and depreciation as disclosed in the financial statement notes to determine the gross carrying value.
ROCE is determined by dividing adjusted EBIT by the carrying value of the Company’s net assets. For the purposes for the ROCE calculation, net assets are defined as total assets on the Company’s consolidated statement of financial position less current liabilities at a point in time.
CROIC and ROCE allow management and others to evaluate the Company’s capital spending efficiency and ability to generate profitable returns by measuring profit or loss relative to the capital employed in the business. Also refer to the “Liquidity and Capital Resources” section of this MD&A for additional information.
The Company has calculated its CROIC and ROCE using annualized results for the three months ended March 31, 2023 and 2022 and balances as at March 31, 2023 and 2022 as follows:
|
Three months ended March 31, | |||
| ($ thousands) | 2023 | 2022 | |
| $ | $ | ||
| Adjusted EBITDA | 89,347 | 91,039 | |
| Annualized Adjusted EBITDA (annualized factor 4x) | 357,388 | 364,156 | |
|
As at March 31, |
|||||
| ($ thousands) | 2023 | 2022 | |||
| $ | $ | ||||
| Exploration and evaluation (E&E) assets – gross carrying value | 16,833 | 29,848 | |||
| Property and equipment (P&E) – net carrying value | 970,614 | 784,466 | |||
| P&E – accumulated D&D | 238,726 | 138,245 | |||
| E&E assets and P&E – gross carrying value | 1,226,173 | 952,559 | |||
| ROU assets – net carrying value | 95,244 | 80,215 | |||
| ROU assets – accumulated depreciation | 28,461 | 17,444 | |||
| E&E, P&E and ROU assets – gross carrying value | 1,349,878 | 1,050,218 | |||
| Annualized CROIC (three months ended March 31) | 26.5% | 34.7% | |||
| Three months ended March 31, |
|||||
| ($ thousands) | 2022 | 2021 | |||
| $ | $ | ||||
| Adjusted EBITDA | 89,347 | 91,039 | |||
| D&D expense | (35,755) | (17,943) | |||
| Adjusted EBIT | 53,592 | 73,096 | |||
| Annualized Adjusted EBIT (annualized factor 4x) | 214,368 | 292,384 | |||
| As at March 31, | |||||
| ($ thousands) | 2022 | 2021 | |||
| $ | $ | ||||
| Total assets | 1,160,406 | 966,375 | |||
| Total current liabilities | (135,880) | (141,260) | |||
| Net assets | 1,024,526 | 825,115 | |||
| Annualized ROCE (three months ended March 31) | 20.9% | 35.4% | |||
Advisory Regarding Forward-Looking Statements
This news release contains certain information and statements (“forward-looking statements”) that constitute forward-looking information within the meaning of applicable Canadian securities laws. Forward-looking statements relate to future results or events, are based upon internal plans, intentions, expectations and beliefs, and are subject to risks and uncertainties that may cause actual results or events to differ materially from those indicated or suggested therein. All statements other than statements of current or historical fact constitute forward-looking statements. Forward-looking statements are typically, but not always, identified by words such as “anticipate”, “estimate”, “expect”, “intend”, “forecast”, “continue”, “propose”, “may”, “will”, “should”, “believe”, “plan”, “target”, “objective”, “project”, “potential” and similar or other expressions indicating or suggesting future results or events.
Forward-looking statements are not promises of future outcomes. There is no assurance that the results or events indicated or suggested by the forward-looking statements, or the plans, intentions, expectations or beliefs contained therein or upon which they are based, are correct or will in fact occur or be realized (or if they do, what benefits Pipestone may derive therefrom).
In particular, but without limiting the foregoing, this news release contains forward-looking statements pertaining to: the positioning of the Company to deliver on its 2023 production guidance range; the construction of wellsite facilities to enable extended flow tests later in Q2 2023; the Company’s intention to install a new gathering pipeline to tie the 11-09 pad into the existing 12-14 battery and the timing thereof; expectations to commence initial flowback operations later in Q2 2023 on the delineation well of the of the 14-14 pad; expectations regarding the Company’s 2023 and 2024 guidance and outlook forecast for each of production, cash flow, capital expenditures/development plans, free cash flow, base dividend, net debt and net cash flow; the Company’s front-loading of capital expenditures in 2023 de-risking its ability to delivery on annual production guidance; the Company's dividend policy, the amounts expected to be paid under the policy and anticipated timing of payment of such dividends; the expected timing for the eight additional wells drilled at the 02-31 and 02-25 pad sites to be on production; and the expected timing of flowback operations on the two wells drilled at the 11-09 pad site.
With respect to the forward-looking statements contained in this news release, Pipestone has assessed material factors and made assumptions regarding, among other things: future commodity prices and currency exchange rates, including consistency of future oil, NGLs and natural gas prices with current commodity price forecasts; Pipestone’s continued ability to obtain qualified staff and equipment in a timely and cost-efficient manner; the predictability of future results based on past and current experience; the predictability and consistency of the legislative and regulatory regime governing royalties, taxes, environmental matters and oil and gas operations, both provincially and federally; Pipestone’s ability to successfully market its production of oil, NGLs and natural gas; the timing and success of drilling and completion activities (and the extent to which the results thereof meet expectations); Pipestone’s future production levels and amount of future capital investment, and their consistency with Pipestone’s current development plans and budget; future capital expenditure requirements and the sufficiency thereof to achieve Pipestone’s objectives; the successful application of drilling and completion technology and processes; the applicability of new technologies for recovery and production of Pipestone’s reserves and other resources, and their ability to improve capital and operational efficiencies in the future; the recoverability of Pipestone 's reserves and other resources; Pipestone’s ability to economically produce oil and gas from its properties and the timing and cost to do so; the performance of both new and existing wells; future cash flows from production; future sources of funding for Pipestone’s capital program, and its ability to obtain external financing when required and on acceptable terms; future debt levels; geological and engineering estimates in respect of Pipestone’s reserves and other resources; the accuracy of geological and geophysical data and the interpretation thereof; the geography of the areas in which Pipestone conducts exploration and development activities; the timely receipt of required regulatory approvals; the access, economic, regulatory and physical limitations to which Pipestone may be subject from time to time; and the impact of industry competition.
The forward-looking statements contained herein reflect management of the Company's current views, but the assessments and assumptions upon which they are based may prove to be incorrect. Although Pipestone believes that its underlying assessments and assumptions are reasonable based on currently available information, undue reliance should not be placed on forward-looking statements, which are inherently uncertain, depend upon the accuracy of such assessments and assumptions, and are subject to known and unknown risks, uncertainties and other factors, both general and specific, many of which are beyond Pipestone’s control, that may cause actual results or events to differ materially from those indicated or suggested in the forward-looking statements. Such risks and uncertainties include, but are not limited to, volatility in market prices and demand for oil, NGLs and natural gas and hedging activities related thereto; the ability to successfully manage the Company's operations; general economic, business and industry conditions; variance of Pipestone’s actual capital costs, operating costs and economic returns from those anticipated; the ability to find, develop or acquire additional reserves and the availability of the capital or financing necessary to do so on satisfactory terms; and the availability of sufficient natural gas processing capacity; and risks related to the exploration, development and production of oil and natural gas reserves. Additional risks, uncertainties and other factors are discussed in the MD&A dated May 10, 2023 and in Pipestone’s annual information form dated March 8, 2023, copies of which are available electronically on Pipestone’s SEDAR profile at www.sedar.com.
The forward-looking statements contained in this news release are made as of the date hereof and Pipestone assumes no obligation to update or revise any forward-looking statements, whether as a result of new information, future events or otherwise, unless required by applicable securities laws. All forward-looking statements herein are expressly qualified by this advisory.
Advisories Regarding Oil and Gas Information
Basis of Barrel of Oil Equivalent
Petroleum and natural gas reserves and production volumes are stated as a “barrel of oil equivalent” (boe), derived by converting natural gas to oil equivalency in the ratio of 6,000 cubic feet of gas to one barrel of oil. Readers are cautioned that boe figures may be misleading, particularly if used in isolation. A boe conversion ratio of 6,000 cubic feet of gas to one barrel of oil is based on energy equivalency, which is primarily applicable at the burner tip, and does not represent a value equivalency at the wellhead.
Initial Production Rates and Short-Term Test Rates
Any references in this news release to test rates of production or initial production rates for certain wells over short periods of time (i.e. IP90 and other short-term periods), are preliminary and not determinative of the rates at which those or any other wells will commence production and thereafter decline. Short-term test rates are not necessarily indicative of long-term well or reservoir performance or of ultimate recovery. Although such rates are useful in confirming the presence of hydrocarbons, they are preliminary in nature, are subject to a high degree of predictive uncertainty as a result of limited data availability and may not be representative of stabilized on-stream production rates. Initial production rates indicate the average daily production over the indicated daily period.
Production over a longer period will also experience natural decline rates, which can be high in the Montney play and may not be consistent over the longer term with the decline experienced over an initial production period. Initial production or test rates may also include recovered “load” fluids used in well completion stimulation operations. Actual results will differ from those realized during an initial production period or short-term test period, and the difference may be material. While encouraging, readers are cautioned not to place reliance on such rates in calculating the aggregate production for Pipestone. Accordingly, Pipestone cautions that the test results should be considered to be preliminary.
Production
References to natural gas and condensate production in this news release refer to the shale gas and natural gas liquids (which includes condensate), respectively, product types as defined in National Instrument 51-101 – Standards of Disclosure for Oil and Gas Activities. References to liquids include tight oil and NGLs (including condensate, butane and propane).
CGR
Any references herein to “CGR” mean condensate/gas ratio and is expressed as a volume of condensate (expressed in barrels) per million cubic feet (mmcf) of natural gas.
Abbreviations
The following summarizes the abbreviations used in this document:
|
Crude Oil, Condensate and other Natural Gas Liquids Natural Gas | ||||
| bbl | barrel | condensate | Pentanes plus (C5+) separated at the field level and C5+ separated from the NGL mix at the facility level | |
| bbls/d | barrels per day | Mcf | thousand cubic feet | |
| boe | barrel of oil equivalent | Mcf/d | thousand cubic feed per day | |
| boe/d | barrel of oil equivalent per day | MMcf | million cubic feet | |
| NGL | natural gas liquids, consisting of ethane (C2), propane (C3) and butane (C4) | MMcf/d | million cubic feet per day | |
| Other Abbreviations | |||
| Adjusted working capital | working capital (current assets less current liabilities), excluding financial derivative instruments and lease liabilities | ||
| C$ | Canadian dollars | ||
| CROIC | cash return on invested capital | ||
| D&D | depletion and depreciation | ||
| E&E | exploration and evaluation | ||
| EBIT | earnings before interest and taxes | ||
| EBITDA | earnings before interest, taxes, depreciation and amortization | ||
| G&A | general and administrative | ||
| GAAP | generally accepted accounting principles | ||
| IFRS | International Financial Reporting Standards | ||
| NCIB | normal course issuer bid | ||
| P&E | property and equipment | ||
| Q1 | first quarter ended March 31st | ||
| Q2 | second quarter ended June 30th | ||
| Q3 | third quarter ended September 30th | ||
| Q4 | fourth quarter ended December 31st | ||
| ROCE | return on capital employed | ||
| ROU | right-of-use | ||
| TSX | Toronto Stock Exchange | ||
| WTI | West Texas Intermediate | ||

![]()
Pipestone Production History
Pipestone Production History
Delineation Map
Delineation Map
2023 Guidance and 2024 Outlook
2023 Guidance and 2024 Outlook
EIN Presswire does not exercise editorial control over third-party content provided, uploaded, published, or distributed by users of EIN Presswire. We are a distributor, not a publisher, of 3rd party content. Such content may contain the views, opinions, statements, offers, and other material of the respective users, suppliers, participants, or authors.